Das folgende mit xelatex laufen lassen.
Open in Online-Editor
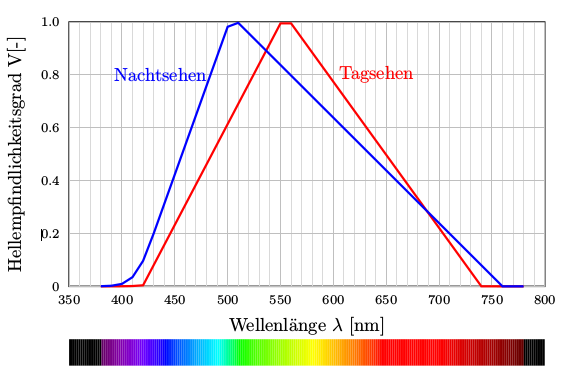
\documentclass{article}\usepackage{filecontents}\begin{filecontents*}{tag.dat}
380 0
390 0.0001
400 0.0004
410 0.0012
420 0.004
550 0.995
560 0.995
740 0.00025
750 0.00012
760 0.00006
770 0.00003
780 0.000015
\end{filecontents*}\begin{filecontents*}{nacht.dat}
380 0.000589
390 0.002209
400 0.00929
410 0.03484
420 0.0966
430 0.1998
500 0.982
510 0.997
760 0.000000425
770 0.000000241
780 0.000000139
\end{filecontents*}\usepackage{fontspec}\usepackage{pst-spectra,pst-plot}\begin{document}\begin{pspicture}(-1,-1.5)(9.1,5.1)
\psaxes[Ox=350,Dx=50,dx=1,xticksize=0 5,yticksize=0 9,
  xsubticks=5,xsubticksize=1,xsubtickcolor=black!15,
  tickcolor=black!25,Dy=0.2,dy=1,labelFontSize=\scriptstyle,
  axesstyle=frame](0,0)(9,5)
\readdata{\tag}{tag.dat}\readdata{\nacht}{nacht.dat}\pstScalePoints(1,1){350 sub 50 div}{5 mul}\pslistplot[linecolor=red,linewidth=1.2pt,plotstyle=line]{\tag}\pslistplot[linecolor=blue,linewidth=1.2pt,plotstyle=line]{\nacht}\rput[l](5.1,4){\textcolor{red}{Tagsehen}}\rput[r](2.6,4){\textcolor{blue}{Nachtsehen}}\psspectrum[begin=350,end=800](0,-1)(9,-1.5)
\rput{90}(-1,2.5){Hellempfindlichkeitsgrad V[-]}\rput(4.5,-0.75){Wellenlänge $\lambda$ [nm]}\end{pspicture}\end{document}